Labor Productivity
See the future!

Interactive Job Screen
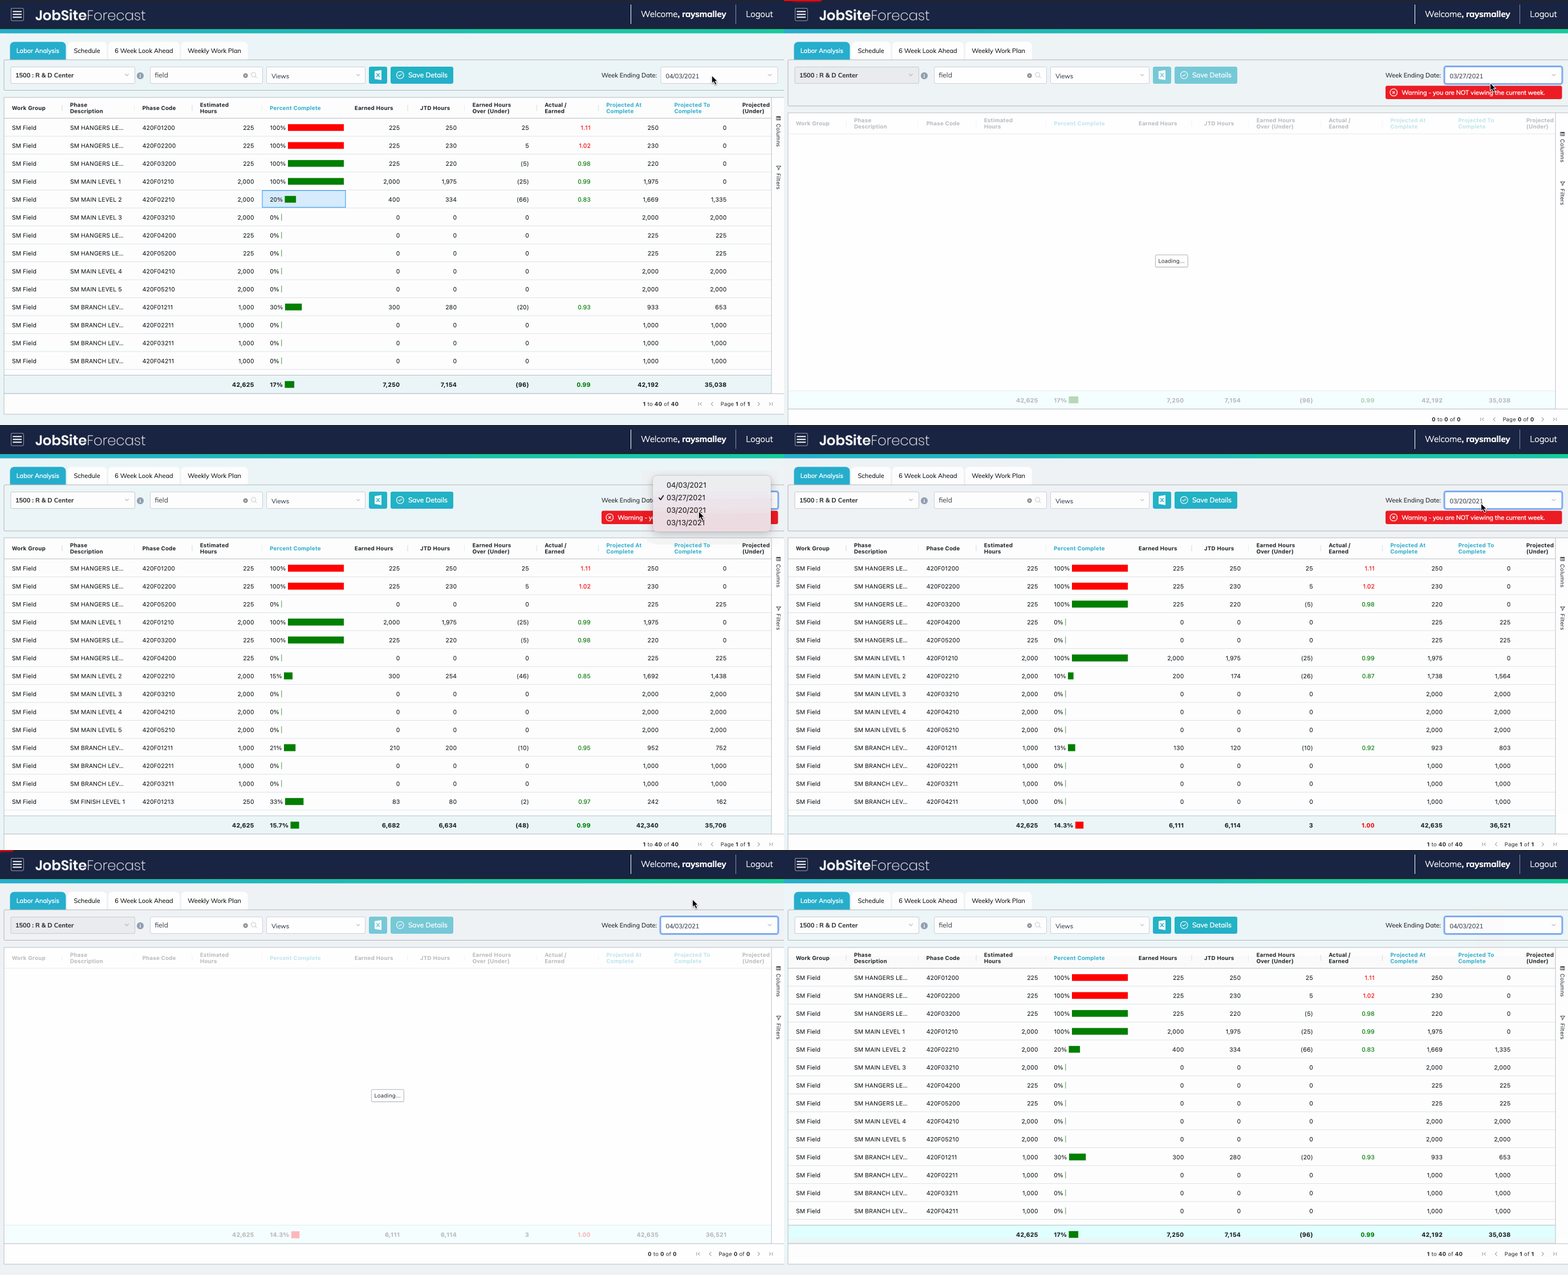
Get your foremen and supers engaged in the process! This interactive screen allows the field foreman to make an entry to each phase or cost code of the project:
- Percent complete
- Projected hours at completion
- Projected hours to complete
From any of those entries the system immediately calculates the projection for that phase or cost code and displays the performance numbers:
- Earned Hours
- Actual/Earned ratio
- Projected at Complete
- Projected Over/Under hours
- Complete list of fields available
Numbers are displayed in red/green to show where performance is above/below standards.
Percent completes are displayed in red/green bar graph to visually show the progress and performance on the project.
Roll Back the Weeks!
Any user can “roll back the weeks” to see the project performance status in previous weeks.
Just click the Week Ending Date drop-down and walk back in history up to 8 weeks.
This data is frozen in time giving a true picture of the project for the selected week. Current estimates, job-to-date hours and all forecast data.


Visualize Your Data
Any data can be viewed graphically. Just highlight the data and click GRAPH.
What to download that graph and send it? No problem…one click.
Tired of Phase or Cost Codes That You Can’t Remember?
How is anyone supposed to remember the 3rd digit of the phase or cost code is the floor?
Just setup descriptions based on the segments of your codes.
Have a master set of descriptions for your company? Great! Enter those as the masters.
Have a job that has different or unique descriptions? No problem, create an over-ride for that job.
Have projects with different phase or cost code structures? No problem. Build as many master structures as you wish and assign them to any project.
Problem solved…No more codes!

